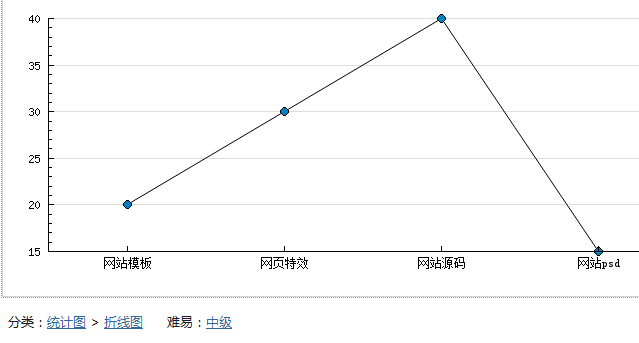
JpGraph一个强大的php图表类库,它使得作图变成了一件非常简单的事情,你只需从数据库中取出相关数据,定义标题,图表类型,然后的事情就交给JpGraph。
0、请不要问“在不在”之类的问题,有问题直接问!1、学生或暂时没有工作的童鞋,整站资源免费下载!2、¥9.9充值终身VIP会员,加我微信,826096331 拉你进VIP群学习!3、程序员加油,技术改变世界。 在线 充值
首先我们定义好图表的标题,数据,描述及尺寸。
$dataArr = array(
            array(
                "num" => "20",
                "legend" => "网站模板",
            ),
            array(
                "num" => "30",
                "legend" => "网页特效",
            ),
            array(
                "num" => "40",
                "legend" => "网站源码",
            ),
            array(
                "num" => "15",
                "legend" => "网站psd",
            ),
        );
        $sizesArr = array(
            "width" => "800",
            "height" => "500",
            "size" => "140"
);
接着我们调用jpgraph()函数。第一个参数标题,第二个参数是数据和描述的二维数组,第三个是生成图表的类型,默认折线图。最后是生成图表的尺寸。
$datas = json_encode($dataArr);
$sizes = json_encode($sizesArr);
jpgraph("素材火www.erdangjiade.com", $datas, 'line',$sizes);
最后我们看下jpgraph()方法:
function jpgraph($title, $json, $mtype = 'line', $sizeArr) {
    $dates = json_decode($json, true);
    if (empty($sizeArr)) {
        $sizes = array(
            "width" => "800",
            "height" => "500",
            "size" => "140"
        );
    } else {
        $sizes = json_decode($sizeArr, true);
    }

    foreach ($dates as $v) {
        $data[] = $v['num']; //数据
        $legend[] = $v['legend']; //说明
    }
    vendor('Jpgraph.Chart');
    $chart = new \Chart;
    $size = $sizes['size']; //尺寸
    $width = $sizes['width']; //宽度
    $height = $sizes['height']; //高度
    /* 上面的参数各种图都是用,比如:饼图 折线图 柱形图等等,需要改变的就是下面的chart.php中的function的名字 */
    if ($mtype == 'line') { //折线图
        $chart->createmonthline($title, $data, $size, $height, $width, $legend);
    } else if ($mtype == 'column') { //柱状图
        $chart->createcolumnar($title, $data, $size, $height, $width, $legend);
    } else if ($mtype == 'pie') { //饼图
        $chart->create3dpie($title, $data, $size, $height, $width, $legend);
    } else { //圆形统计图
        $chart->createring($title, $data, $size, $height, $width, $legend);
    }
}


友情提示:垃圾评论一律封号 加我微信:826096331拉你进VIP群学习群