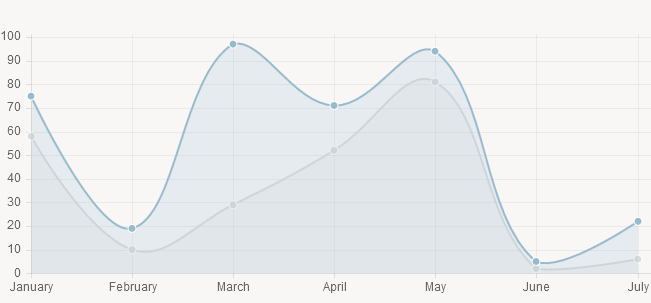
今天分享一款统计图插件:chart.js。统计图演示有 折线图Line Chart 折线图自定义工具提示Line Chart with custom tooltips 长条图Bar Chart 环形图Doughnut Chart 圆形统计图Pie Chart等
0、请不要问“在不在”之类的问题,有问题直接问!1、学生或暂时没有工作的童鞋,整站资源免费下载!2、¥9.9充值终身VIP会员,加我微信,826096331 拉你进VIP群学习!3、程序员加油,技术改变世界。在线 充值
HTML
首先我们在页面上放置一个生成统计图的画布#canvas
<canvas id="canvas" height="450" width="600"></canvas>引入统计图插件Chart.js
<script src="js/Chart.js"></script>自定义参数
var lineChartData = {
    labels: ["January", "February", "March", "April", "May", "June", "July"],
    datasets: [{
        label: "My First dataset",
        fillColor: "rgba(220,220,220,0.2)",
        strokeColor: "rgba(220,220,220,1)",
        pointColor: "rgba(220,220,220,1)",
        pointStrokeColor: "#fff",
        pointHighlightFill: "#fff",
        pointHighlightStroke: "rgba(220,220,220,1)",
        data: [randomScalingFactor(), randomScalingFactor(), randomScalingFactor(), randomScalingFactor(), randomScalingFactor(), randomScalingFactor(), randomScalingFactor()]
    },
    {
        label: "My Second dataset",
        fillColor: "rgba(151,187,205,0.2)",
        strokeColor: "rgba(151,187,205,1)",
        pointColor: "rgba(151,187,205,1)",
        pointStrokeColor: "#fff",
        pointHighlightFill: "#fff",
        pointHighlightStroke: "rgba(151,187,205,1)",
        data: [randomScalingFactor(), randomScalingFactor(), randomScalingFactor(), randomScalingFactor(), randomScalingFactor(), randomScalingFactor(), randomScalingFactor()]
    }]
}
调用统计图插件
window.onload = function() {
    var ctx = document.getElementById("canvas").getContext("2d");
    window.myLine = new Chart(ctx).Line(lineChartData, {
        responsive: true
    });
}


友情提示:垃圾评论一律封号 加我微信:826096331拉你进VIP群学习群