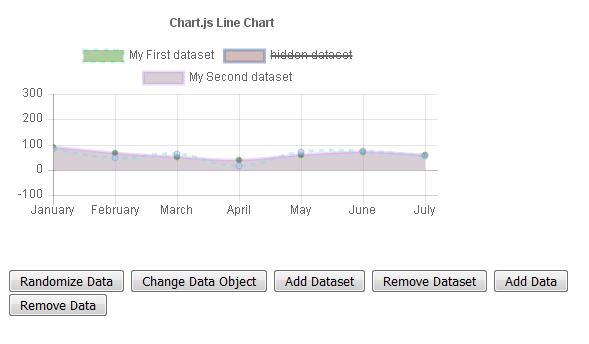
Chartjs是一款html5统计图插件,有条形图,折线图,饼图,用户可以用 6 中不同的方式来可视化数据。每个方式都是动画效果的,完全自定义,插件皮肤很NICE。
0、请不要问“在不在”之类的问题,有问题直接问!1、学生或暂时没有工作的童鞋,整站资源免费下载!2、¥9.9充值终身VIP会员,加我微信,826096331 拉你进VIP群学习!3、程序员加油,技术改变世界。在线 充值
Chartjs使用教程
var config = {
    type: 'line',
    data: {
        labels: ["January", "February", "March", "April", "May", "June", "July"],
        datasets: [{
                label: "My First dataset",
                data: [randomScalingFactor(), randomScalingFactor(), randomScalingFactor(), randomScalingFactor(), randomScalingFactor(), randomScalingFactor(), randomScalingFactor()],
                fill: false,
                borderDash: [5, 5],
            }, {
                hidden: true,
                label: 'hidden dataset',
                data: [randomScalingFactor(), randomScalingFactor(), randomScalingFactor(), randomScalingFactor(), randomScalingFactor(), randomScalingFactor(), randomScalingFactor()],
            }, {
                label: "My Second dataset",
                data: [randomScalingFactor(), randomScalingFactor(), randomScalingFactor(), randomScalingFactor(), randomScalingFactor(), randomScalingFactor(), randomScalingFactor()],
            }]
    },
    options: {
        responsive: true,
        title: {
            display: true,
            text: 'Chart.js Line Chart'
        },
        tooltips: {
            mode: 'label',
            callbacks: {
                // beforeTitle: function() {
                //     return '...beforeTitle';
                // },
                // afterTitle: function() {
                //     return '...afterTitle';
                // },
                // beforeBody: function() {
                //     return '...beforeBody';
                // },
                // afterBody: function() {
                //     return '...afterBody';
                // },
                // beforeFooter: function() {
                //     return '...beforeFooter';
                // },
                // footer: function() {
                //     return 'Footer';
                // },
                // afterFooter: function() {
                //     return '...afterFooter';
                // },
            }
        },
        hover: {
            mode: 'dataset'
        },
        scales: {
            xAxes: [{
                    display: true,
                    scaleLabel: {
                        show: true,
                        labelString: 'Month'
                    }
                }],
            yAxes: [{
                    display: true,
                    scaleLabel: {
                        show: true,
                        labelString: 'Value'
                    },
                    ticks: {
                        suggestedMin: -10,
                        suggestedMax: 250,
                    }
                }]
        }
    }
};

$.each(config.data.datasets, function(i, dataset) {
    dataset.borderColor = randomColor(0.4);
    dataset.backgroundColor = randomColor(0.5);
    dataset.pointBorderColor = randomColor(0.7);
    dataset.pointBackgroundColor = randomColor(0.5);
    dataset.pointBorderWidth = 1;
});
js模板结构图
- bar-horizontal.html
- bar-multi-axis.html
- bar-stacked.html
- bar.html
- bubble.html
- combo-bar-line.html
- data_label_combo-bar-line.html
- different-point-sizes.html
- doughnut.html
- index.html
- line-customTooltips.html
- line-legend.html
- line-logarithmic.html
- line-multi-axis.html
- line-multiline-labels.html
- line-skip-points.html
- line-stacked-area.html
- line-x-axis-filter.html
- pie-customTooltips.html
- pie.html
- polar-area.html
- radar-skip-points.html
- radar.html
- scatter-logX.html
- scatter-multi-axis.html
- scatter.html
- tooltip-hooks.html


友情提示:垃圾评论一律封号 加我微信:826096331拉你进VIP群学习群